Table of Contents
The pandemic vividly reveals how the deep-seated legacy of racist land use, employment, education, and health policies devastate California’s low-income communities of color. These communities were struggling before being hard hit by the pandemic. Now, COVID-19 lays bare the long-term effect of failing to address systemic inequity. As state and local governments craft their annual budgets, they must center equity in their budget processes and provide immediate relief by directing investments to offset long-standing inequities in public health, education, jobs, living wages, food security, and economic and housing stability. RACE COUNTS’ new COVID-19: Statewide Vulnerability & Recovery Index provides policymakers, advocates, and other Californians a tool to inform equity-based resource allocations and a means to target services equitably.
In less than one year, over 3,250,000 Californians have contracted the virus—and over 40,000 have died from it. Amongst those, Latinx and Native Hawaiian and Pacific Islanders (NHPI) have the highest case rates. Black, NHPI, and Latinx Californians have the highest death rates.1
As an example of economic impact, Los Angeles County has the largest number of people living under or near the poverty line in California (about 4 million).2 Data show that L.A. communities in deep poverty (i.e., areas with higher percentages of residents under 200% of the federal poverty level) have nearly three times as many COVID-19 cases as those that are not.3
Thus, the need to better protect low-income communities—and Black, Latinx, NHPI, and American Indian and Alaskan Native (AIAN) Californians—from COVID-19 could not be more evident. At stake are not only their health and safety but also our collective well-being. Communities of color and low-income people are disproportionately on the frontlines as essential workers. Put plainly, they keeping our society running. They deliver our mail, groceries, and online purchases, provide care for the elderly and offer a whole host of other essential services and supports. These often-under-noticed activities allow businesses to operate and enable wealthier Californians to shelter in place safely. The short- and long-term health, safety, and welfare of essential workers should therefore be prioritized.
On January 8, 2021, Governor Gavin Newsom released his proposed state budget for the 2021-22 fiscal year. Notably, it includes several equity components, including a request to extend the state eviction moratorium, a one-time $600 tax refund for low-income people, $2 billion for safe school in-person instruction, and over $1 billion for COVID-19 public health activities.4
While this starting point deserves praise, the level of devastation in hardest-hit communities requires that equity be further integrated into both the Governor and Legislature’s decision-making about the state budget and any other governmental pandemic and recession policies. RACE COUNTS’ new COVID-19: Statewide Vulnerability & Recovery Index (the “Vulnerability & Recovery Index” or “Index”) is a tool that will help policymakers and community stakeholders pinpoint inequities and take action to reverse devastating trends. The Index shows how pandemic and economic relief allocations can meaningfully account for systemic biases based not only on race and class but also place. It identifies communities most at risk of being disproportionately impacted by COVID-19 – in terms of immediate and long-term health and economic risks.
Furthermore, while it may be challenging to focus on post-pandemic equity in the midst of unprecedented numbers of low-income Californians of color losing their jobs, homes, educations, and loved ones, these stark realities show that elected officials can no longer afford to ignore the systemic biases that undergird our society. Thus, in addition to using the Index to immediately locate and act in areas in dire need of relief, policymakers should lean into the Index for future equity-centered interventions. This means that long-term public investments, policy reforms, and programs should use the Index to offset entrenched racism within and across our employment, education, housing, health care, land use, and criminal justice systems. Below are a summary of the Index and its key findings, and policy recommendations for immediate and longer-term government actions that will effectively support the highest-need communities.
The COVID-19 Statewide Recovery And Vulnerability Index
The Index uses ZIP Code-level data to identify California communities most in need of immediate and long-term pandemic and economic relief. Policymakers and community stakeholders should use it to determine where to target interventions.
Specifically, the Index is comprised of three components — Risk, Severity, and Recovery Need with the last scoring the ability to recover from the health, economic, and social costs of the pandemic. Communities with higher Index scores face a higher risk of COVID-19 infection and death and a longer uphill economic recovery. Conversely, those with lower scores are less vulnerable.
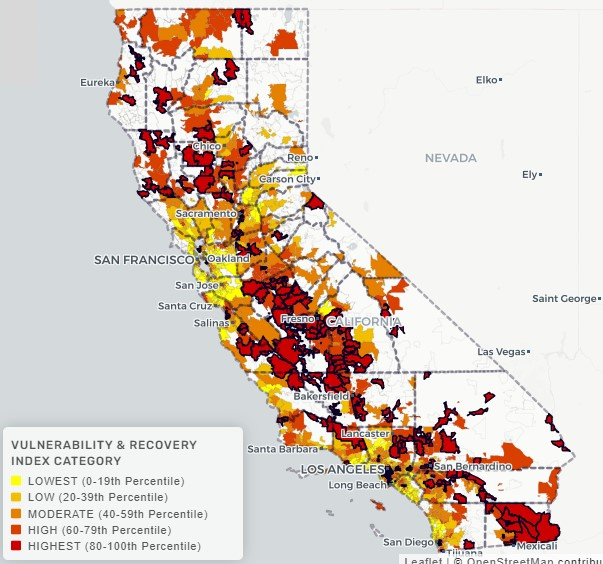
The maps below show each ZIP Code’s Index scores from Highest to Lowest Need, emphasizing the Highest-Need ZIP Codes. These are the ZIP Codes in the top 20th percentile of the Index, or with the greatest need for support. We recommend that they be prioritized by government officials moving forward.
Methods: Behind the Index are three component scores. Each component score includes a set of indicators we found to be associated with COVID-19 risk, severity, or recovery in our review of existing indices and independent analysis. COVID-19 case rates are not included as an indicator because there is incomplete case data at the ZIP Code level across the state. The component scores are calculated with the following indicators.
Risk Score: Risk of COVID-19 infection derived from the average of Black, Latinx, AIAN, and NHPI residents as a percent of population, Essential Workers (%), Population under 200% of Federal Poverty Level (%), and Overcrowded Housing Units (%).
Severity Score: Risk of severe illness or death from COVID-19 derived from the average of Black, Latinx, AIAN, and NHPI residents as a percent of population, Population under 200% of Federal Poverty Level (%), Population Age 75+ in Poverty (%), Uninsured Population (%), Heart Disease-Related Hospitalization Rate (per 10,000), and Diabetes Hospitalization Rate (per 10,000).
Recovery Need Score: Vulnerability of community to economic and social costs of pandemic derived from the average of Black, Latinx, AIAN, and NHPI residents as a percent of population, Essential Workers (%), Population under 200% of Federal Poverty Level (%), Unemployment Rate, and Uninsured Population (%).
These component scores are then combined into the overall Index. Using these results, we assign categories to each ZIP Code from Highest to Lowest Need.
Key Findings
Large portions of the Central Valley, the Inland Empire, Imperial County, and South / Southeast greater Los Angeles area fall within the Highest Need category. The Central Valley is home to large agricultural and food processing industries. The Inland Empire and South / Southeast Los Angeles both have a large presence of warehouses and logistics centers. Workers in these industries have faced unsafe working conditions due to a lack of personal protective equipment and safety practices and because they work close to others.5,6 Imperial County has exceptionally high unemployment and poverty rates. Nearly all of these regions are home to large communities of color, particularly Latinx residents.
Many northern California ZIP Codes from Colusa up to Del Norte County are also in the Highest Need category. Many of these areas have high rates of hospitalizations for heart disease and diabetes, conditions that are associated with more serious COVID-19 illness and death, resulting in high Severity component scores. Higher rates of essential workers contribute to higher Risk scores. Large AIAN populations, accompanied by higher poverty rates and large Latinx populations in some areas, all of whom have experienced a disproportionate impact from the pandemic, also contribute to higher Index scores.
Risk, Severity, and Recovery Need scores generally align with the overall Index scores. However, a closer examination of component scores does reveal some differences. Alameda County has only five High or Highest Need ZIP Codes, while it has 10 with High or Highest Need Risk scores. San Diego County has 17 High or Highest Need ZIP Codes, but 26 with High or Highest Recovery Need scores. These differences can help guide the specific types of supports needed in each area. For example, areas with the Highest Severity scores may need more outreach and services to older populations and those with certain medical conditions.
Overall Index scores are strongly correlated7 with COVID-19 case rates based on the case data available at the ZIP Code level. This suggests that areas with higher case rates likely also have higher Index scores. As a result, the Index is a useful tool to measure the local impacts of the pandemic even though it does not directly include COVID-19 case data.
The Index accurately captures many of the groups that have experienced the highest COVID-19 case and death rates. Highest-Need ZIP Codes have a large share of Latinx and AIAN Californians, and people in poverty. Many Highest Need ZIP Codes also have a high percent of Black residents.
Small area-based race and ethnicity figures do not adequately capture NHPI populations, and in more urban areas, AIAN populations because they often are not as geographically concentrated as other racial and ethnic groups. As a result, statewide or countywide interventions in addition to targeted ZIP Code-based approaches are needed to support these two groups.
Recommendations
Our government, at all levels, must act immediately. Immediate action includes responding to ongoing COVID-19 infections, ensuring an equitable distribution of vaccines, and providing real economic recovery for hardest-hit communities.
Californians need financial support to weather the remainder of the pandemic. Aid for small businesses and low-income entrepreneurs is needed today. We must do more to prioritize the health and safety of low-income people of color and put them on a path to not only recover but thrive in the future. To do this, policymakers should focus on ZIP Codes with an overall score in the Index’s top 20th percentile.
The following recommendations for state, local, and national policymakers provide guidance on how to address the immediate and long-term health and economic impacts of COVID-19.
Center equity in vaccine distribution:
- Data show that because of structural barriers—such as access to health care, economic inequity, and historic and present-day racism—people of color are less likely to be vaccinated.8 To offset this, our Index—which accounts for racial inequities and others—should be used to prioritize communities most in need;
- Prioritize vaccinating individuals and their families who have been disproportionately impacted by COVID-19 or who are at high infection risk. These individuals include, but are not limited to, Latinx, Black, NHPI, and AIAN individuals, essential workers who must work in-person and live in multi-generational/multi-family households, and individuals living in congregate settings;
- Ensure that vaccine distribution sites are accessible through multiple modes and are open during hours that accommodate a variety of work schedules;
- Build trust and leverage trusted messengers in impacted communities to facilitate vaccine access and uptake; and
- Engage and center Latinx, Black, NHPI, and AIAN communities in COVID-19 vaccine policy responses.
Build a cadre of community-based responders in hardest-hit communities by leveraging trusted community-based organizations (CBOs):
- Create a statewide Equity Corps program that would channel state funds to CBOs working in COVID-19 hotspots and for highly impacted communities. The state funding would support CBO resident outreach efforts, including providing information on public health guidance and vaccine access, as well as connecting residents to resources to help them bridge the digital divide, access support for mental health, food, housing, and other basic needs, and inform them about the new rights and resources for workers and tenants.
Provide additional support for local public health departments and small businesses:
- Increase state and federal funding for public health departments to fulfill their mandates; and
- Provide financial support to small businesses and low-income entrepreneurs.
Protect workers and lift their voices and expertise to keep workplaces safe:
- Make medical grade face masks available to workers whose jobs require them to work in-person;
- Increase public health departments’ workplace compliance staffing levels;
- Create workplace public health councils and protect workers against retaliation for reporting employer non-compliance with public health directives;
- Provide monetary stipends and free quarantine facilities to infected low-wage essential workers;
- Enact policies to guarantee workers’ right to return to their jobs following illness and quarantine;
- Publicly and consistently, weekly at a minimum, disclose worksite outbreaks by employer and location;
- Ensure workers affected by business closures—such as workers in non-essential retail, malls, gyms, and other categories deemed appropriate by public health officials—have immediate financial support, especially those who do not qualify for state or federal relief; and
- Increase enforcement against businesses and employers that violate health orders to hold them accountable and, if needed, shut them down to protect public health.
Target government aid to vulnerable individuals and communities:
- Extend unemployment insurance to all workers impacted by the pandemic;
- Target government aid to the most-impacted households, communities, and highest need geographic locations; and
- Extend eviction moratoriums and find a path to cancel rental obligations and mortgage payments for low-income Californians.
Build the future resilience of highest-need communities:
- Direct public investments to improve the long-term overall socioeconomic welfare of communities in ZIP Codes with a Recovery Need score in the top 20th percentile. This should include a focus on offsetting longstanding under-investments in public health, jobs, living wages, education, food security, and economic and housing stability for low-income communities of color, and corresponding over-investments in incarcerating and policing people of color.
- Partner with CBOs and messengers deeply rooted in serving communities in ZIP Codes with a Recovery Need score in the top 20th percentile to not only identify the root causes of racial and economic marginalization but also empower community members by leveraging their lived experiences to craft bottom-up solutions that have long-term durability and efficacy.
Conclusion
A legacy of racist policymaking created vulnerable communities that were fertile ground for COVID-19 infection, spread, and death. Only policies rooted in equity can begin to repair the harm that has been done. This means that policymakers must continue to take action to control the pandemic by maintaining life-saving restrictions, develop equity-based vaccine distribution protocols, and seed an equitable long-term economic recovery in California’s highest-need communities.
Policymakers should not give in to pressure from special interests, pursue low-hanging fruit, or divide resources equally by the number of political districts in a jurisdiction regardless of need. Rather, they should take an equity-centered approach.
An equity-centered approach must be rooted in data on disparate impact. The COVID-19: Statewide Vulnerability & Recovery Index provides the data needed to identify the California communities disproportionately suffering now, and most at risk of enduring negative long-term economic and health consequences. Our long-term, collective economic welfare is rooted in the well-being of the communities of color and low-income people who disproportionately make-up our essential workforce.
Our Highest Need communities and essential workers must be protected now and equipped for long-term success. Policymakers should ensure that vaccines are distributed equitably, build up our public health infrastructure—including community-based rapid response systems, protect workers, and target government aid to vulnerable individuals, communities, and small businesses. In addition, government investment should not stop at immediate pandemic relief. It must go further and target and allocate resources to build the future resilience of the Highest Need communities identified in the Index. Doing so is not only just, but also places us on a path toward greater equity and a more resilient collective well-being.
Data And Methods
Methods
Three components make up the COVID-19: Statewide Vulnerability & Recovery Index:
- Risk Percentile Score measures the risk of COVID-19 infection;
- Severity Percentile Score measures the risk of severe illness or death from COVID-19; and
- Recovery Need Percentile Score measures the needs related to economic and social recovery.
We first calculate the percentage and rate estimates for each indicator and then assign ZIP Code percentile scores based on how they rank from highest to lowest for each indicator. Each ZIP Code is then given component scores by averaging indicator percentiles within each component and ranking these averages from highest to lowest to calculate percentile scores. Then we average the component percentile scores, and the percentile of that average is the COVID-19: Statewide Vulnerability & Recovery Index percentile score. The use of percentile scores and components to create a single composite index closely relates to the CalEnviroScreen 3.0 methodology.
To identify indicators, we reviewed existing research and related indexes from sources such as the Centers for Disease Control and Prevention, the Public Health Alliance of Southern California, New York University, the California Health Interview Survey, and others. We then tested these indicators for their reliability9 at the ZIP Code level and their correlations with COVID-19 case rates. Because ZIP Code level case data are not available statewide, we relied on existing research around COVID-19 and community characteristics and our correlation analysis of indicators with case rates where data are available, to make the final indicator list. We narrowed our list to a set of nine indicators across the three components.
The Risk Percentile Score includes: Average percentile of Black, Latinx, AIAN, and NHPI residents as a percent of population, Essential Workers (%), Population under 200% of Federal Poverty Level (%), and Overcrowded Housing Units (%).
The Severity Percentile Score includes: Average percentile of Black, Latinx, AIAN and NHPI residents as a percent of population, Population under 200% of Federal Poverty Level (%), Population Age 75+ in Poverty (%), Uninsured Population (%), Heart Disease-Related Hospitalization Rate (per 10,000), and Diabetes Hospitalization Rate (per 10,000).
The Recovery Need Percentile Score includes: Average percentile of Black, Latinx, AIAN, and NHPI residents as a percent of population, Essential Workers (%),10 Population under 200% of Federal Poverty Level (%), Unemployment Rate, and Uninsured Population (%).
Each indicator is naturally weighted by the number of components it falls within. In other words, because our race indicator falls across all three components, it is included three times in the Index, or essentially weighted by three. We excluded ZIP Codes without reliable11 estimates for at least half of the indicators within any component. ZIP Codes with less than 500 population are also excluded.
ZIP Code Categorization Methodology: Using the Index score, we calculate a percentile rank for all 1,301 California ZIP Codes included in our index. To identify our recommended list of Highest Need ZIP Codes for targeted interventions, we focus on ZIP Codes in the top 20th percentile of the index, which narrows to the 261 Highest Need ZIP Codes. ZIP Codes between the top 20th and 40th percentiles fall into the High Need category, and so on.
Limitations: COVID-19 data is not available at ZIP Code level statewide; therefore, this Index approximates the impact of the pandemic using indicators linked to COVID-19 through previous research and our own correlation analysis using available ZIP Code-level COVID-19 data. In addition, this Index includes only rates and percentages. As such, it does not measure the scale or consider the number of individuals impacted in each ZIP Code. This approach allows for less populated but highest-impacted ZIP Codes to be highlighted but could also result in some very high population ZIP Codes with high need to receive less focus. This Index relies heavily on American Community Survey data which is published for ZIP Code Tabulation Areas (ZCTAs) not ZIP Codes. As a result, the number and location of ZCTAs and ZIP Codes may not align perfectly. Finally, this Index does not take into account the resources and strengths of the communities and instead is focused on the risk factors and needs of the communities. Local community-based organizations are one such example of community strength and resources.
Data sources
Total Population, Race, Ethnicity, Housing, Employment, and Poverty Estimates: American Community Survey 5-Year Estimates, 2019. Tables referenced include: DP05, B25014, S1701, B17020, S2301, S2401, S2701. Retrieved from https://data.census.gov/cedsci/.
Hospitalization Data: California Office of Statewide Health Planning and Development, 2017-2019.
Download data table used for report analysis.
Acknowledgments
Recommendations developed in partnership with the RACE COUNTS Steering Committee.
Research and data analysis by Leila Forouzan, Elycia Mulholland Graves, Chris Ringewald, Rob Graham, and Jennifer Zhang.
Written by Leila Forouzan, Elycia Mulholland Graves, and Chauncee Smith.
Conceptualization support from John Kim and Maria Cabildo.
Editing support from Maria Cabildo, Mike Russo, Amy Sausser, Katie Smith, Ron Simms Jr., Chris Ringewald, and Jacky Guerrero.
Design and page development by Rob Graham and Katie Smith.
Citations
1 Latinx case rates are 3.1 times greater than the lowest racial group. NHPI case rates are 3.5 times greater than the lowest group. Black, NHPI, and Latinx death rates are 1.45, 1.55, and 1.88 times greater than the lowest racial group. See Maria Cabildo, Elycia Mulholland Graves, and Matt Trujillo. “Statewide Report: How Race Fuels a Pandemic.” Advancement Project California, December 2020. http://www.racecounts.org/covid-statewide/ (Data as of Jan. 31, 2021). ↩︎
2 Caroline Danielson. “The COVID-19 Crisis is Affecting Low-Income Workers.” Public Policy Institute of California, March 19, 2020. https://www.ppic.org/blog/the-covid-19-crisis-is-affecting-low-income-workers/ (“[T]he poverty line on average for a family of two adults and two children is about $32,400; the deep poverty line is $16,200, and the near-poverty line is $48,500.”). ↩︎
3 Maria Cabildo, Elycia Mulholland Graves, John Kim, and Michael Russo. “Report: How Race, Class, and Place Fuel a Pandemic.” Advancement Project California, 2020. http://www.racecounts.org/covid/ (case rate data as of Nov. 11, 2020). ↩︎
4 “Governor’s Proposed Budget Summary 2021-22, Equitable and Broad-Based Recovery,” Office of Governor Newsom, Jan. 8, 2021. http://www.ebudget.ca.gov/2021-22/pdf/BudgetSummary/EquitableandBroad-BasedRecovery.pdf. ↩︎
5 Manke, Kara. “California farmworkers hit hard by COVID-19, study finds.” Berkeley News, Dec. 2, 2020. https://news.berkeley.edu/2020/12/02/california-farmworkers-hit-hard-by-covid-19-study-finds/. ↩︎
6 Kyle Bagenstose, Sky Chadde, and Rachel Axon. “COVID-19 deaths go uninvestigated as OSHA takes a hands-off approach to meatpacking plants.” https://www.usatoday.com/in-depth/news/2021/01/11/covid-19-deaths-not-investigated-osha-meatpacking-plants/6537524002/. ↩︎
7 Correlation results are based on the original version of the index released on 1/31/21. Correlation coefficients range from –1 to 1. The closer the correlation coefficient is to –1 or 1, the stronger the relationship between the two variables. The correlation coefficient for the relationship between the Index percentile scores and COVID-19 case rates, on December 29, 2020, is .65. We chose December 29, 2020, as the date for the COVID-19 data in the correlation analysis because it is both recent to the writing of this report and it is the date in December with the maximum number of ZIP Codes reporting COVID-19 case data. This analysis included case data for 514 ZIP Codes across 17 counties. The more ZIP Codes we are able to include in the analysis, the more confidence we can have in the correlation results. ↩︎
8 Samantha Artiga and Jennifer Kates. “Addressing Racial Equity in Vaccine Distribution,” Kaiser Family Foundation, Dec. 3, 2020. https://www.kff.org/racial-equity-and-health-policy/issue-brief/addressing-racial-equity-vaccine-distribution/. ↩︎
9 We use the Coefficient of Variation to determine estimate reliability. The Coefficient of Variation is calculated as the ratio of the standard deviation to the mean. The lower the value, the higher the reliability of the estimate. ↩︎
10 We define essential workers using the Urban Institute’s report on worker exposure and risk (https://www.urban.org/sites/default/files/publication/103278/how-risk-of-exposure-to-the-coronavirus-at-work-varies.pdf) as a basis. We broadly include: Business and financial operations occupations; Community and social service occupations; Educational instruction, and library occupations; Healthcare practitioners and technical occupations; Healthcare support occupations; Protection service occupations; Food preparation and serving related occupations; Building and grounds cleaning and maintenance occupations; Natural, resources, construction, and maintenance occupations; and Production, transportation, and material moving occupations. ↩︎