Source: Multi-Resolution Land Characteristics Consortium, National Land Cover Database
By: Chris Ringewald
Senior Director of Research & Data Analysis, Catalyst California
First-of-Its-Kind Data
At RACE COUNTS, we’re big fans of data about communities and how it can build power and promote racial justice. One index we’ve used in related work is the Child Opportunity Index from diversitydatakids.org. Access to Greenspace is one of the indicators included in the second version of the index, measured as the percentage of impervious surface areas such as rooftops, roads and parking lots. We liked the indicator so much that we imitated it, making two important upgrades. We updated the vintage from 2015 to 2019 (with 2021 available this Fall) and calculated weighted averages by race to understand whether the percentage of impervious land cover differs by race (see our Methodology for city, county, and state calculations for details). To our knowledge, this data is not available anywhere else.
Why It Matters
This first-of-its kind data gives us insights into several important environmental factors. The percentage of impervious land cover indicates the potential impact of water pollution and heat vulnerability and a relative lack of parks and open space. Impervious surfaces reduce the amount of rain that goes to groundwater, further impacting water availability in a state prone to drought. This indicator provides support for advocacy on all those fronts.
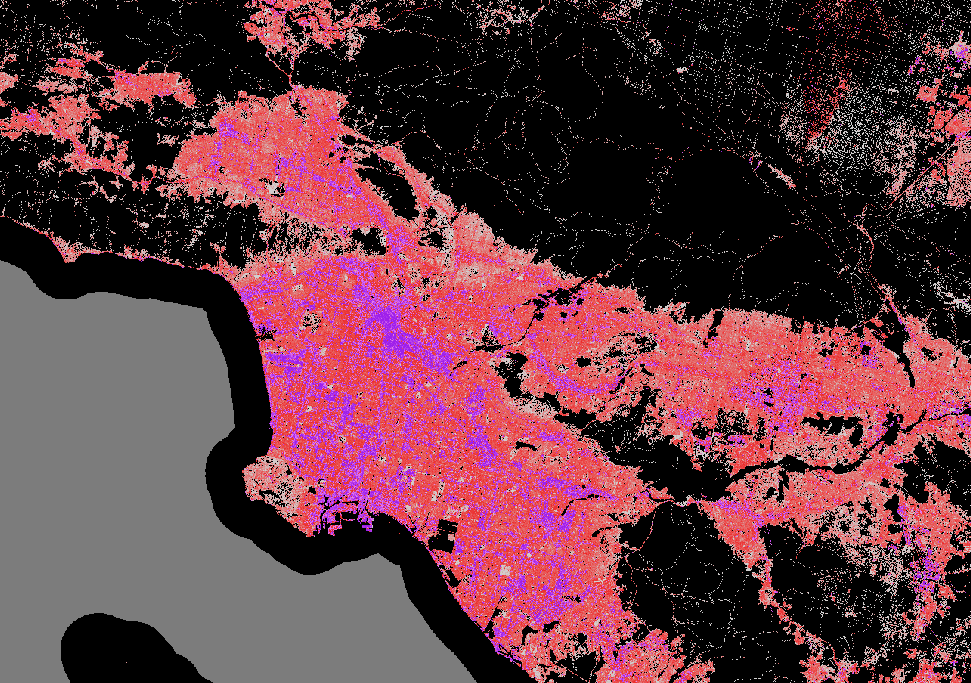
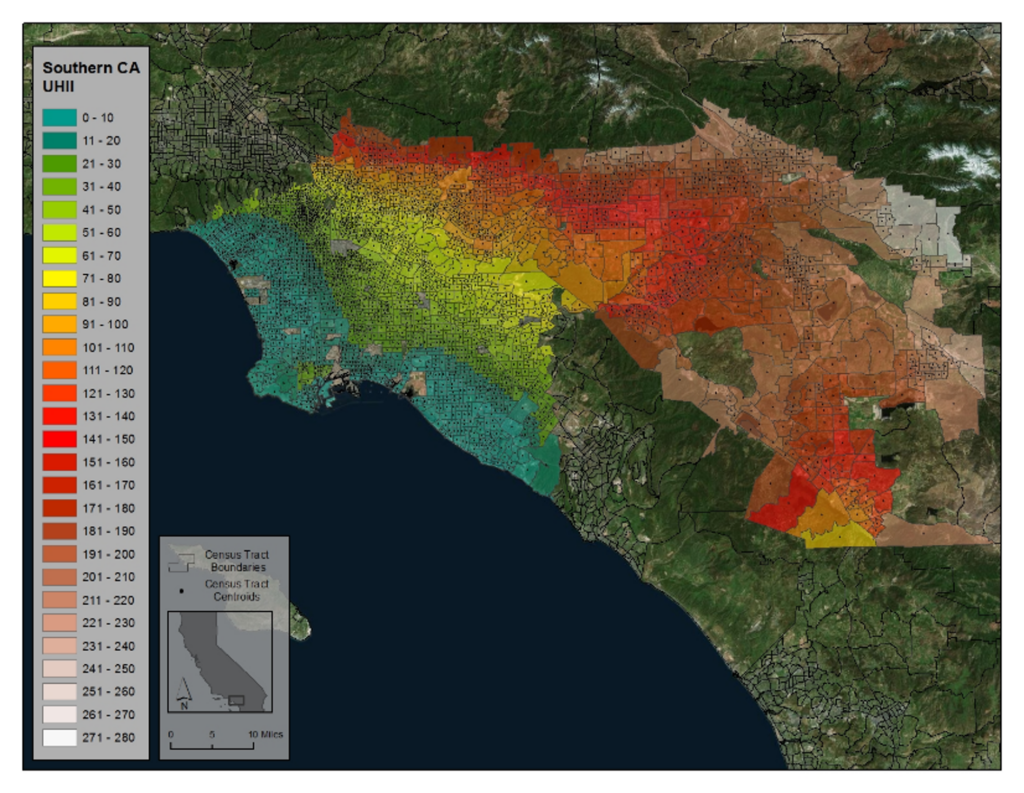
- While heat island indicators correctly measure heat and heat vulnerability, vast spans of impervious surfaces are one prominent source of the problem and the heat itself the bad outcome of it (see urban heat island index image below). Impervious surfaces make for a good advocacy target, because they get to one root of the problem.
- Parks and open space indicators effectively detail access to an important resource for families, but they often don’t account for the differences in access to backyards and tree canopies in more suburban neighborhoods (see limitation in City Health Dashboard indicator, a project and indicator we like for other applications). The impervious land indicator accounts for them and rightfully shows the lack of greenspace in more urban areas.
An Example in Action
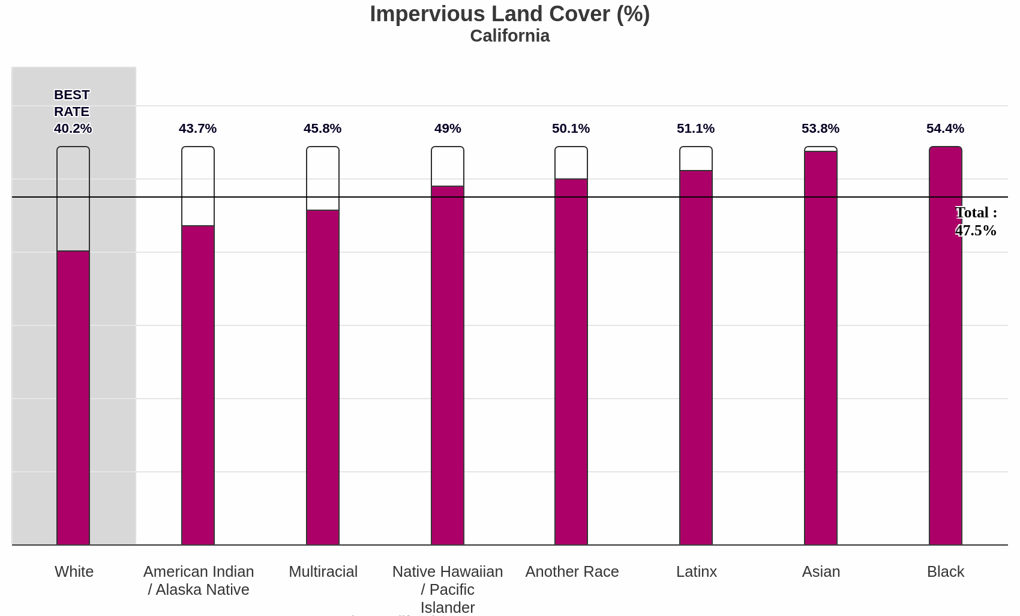
The impervious land indicator – which we label as Lack of Greenspace – shows that outcomes vary by racial-ethnic group, meaning that different groups are more likely to experience the impacts of pollution, heat islands, and a lack of parks and open spaces than others.
Just under half (47.5%) of the average populated census tract in California is covered with impervious land. That average dips to 40.2% in neighborhoods where White Californians are more likely to live and increases to 54.4% in neighborhoods where Black Californians are more likely to live: a difference of 14.2 percentage points. California has six counties where more than half of all land is covered in impervious surfaces.
Conclusion
The California example masks disparities in impervious land – or lack of greenspace – in counties and cities across the state. These disparities, and the resulting heat, pollutants, and lack of recreational space, are the result of past racism in housing and zoning laws such as redlining, as well as extralegal discrimination that kept people of color out of more affluent, suburban neighborhoods. The continuing lack of investment in communities of color sustains the disparities. This discrimination occurred regardless of income and whether a neighborhood was “progressive” or not. For example, Willie Mays, one of the wealthiest, most successful baseball players of his era, was famously denied housing in San Francisco because of his race until a wider city effort pressured the owner to sell to him. We’re excited that this impervious land data can connect this history to current advocacy efforts. To see whether there are disparities in impervious land or greenspace by race where you live Explore The Data by Place.
Learn More
The relationship between urban heat islands and segregation
Policy Solutions
Three policy solutions that can advance park equity
Green Infrastructure: Advance Climate Resilience and Promote Health Equity
Greenspace Policies as Key Solutions to Help Cities Improve Health Outcomes