City level data
We are excited to share that RACE COUNTS now has racial disparity and outcomes data from nearly 500 California cities. RACE COUNTS has long been a valuable tool for the racial justice field as one of the only resources that provides racial disparity data and analysis across multiple issue areas and indicators. With the addition of city data, RACE COUNTS can impart more value to community-based-organizations, advocates, elected officials, and the media by showing where their local communities stand.
Why It Matters
There are a number of reasons why it is important to have racial disparity and outcomes data not just at the state and county level but also at the city level as well. One primary reason is that looking at data at a larger geographic level like county can mask disparities and inequities at more local levels. California is home to some of the largest counties in the country, and the racial disparity and outcomes in many California cities can look quite different from one another. In addition, many policies that impact racial disparity and outcomes operate at a local, city (vs. county) level. To best understand these policies’ impact and inform campaigns to change them, it is helpful to have city-level data.
A Tale Of Two Cities
To illustrate the value of city level data we will tell a tale of two cities in Sacramento County: Sacramento city and Folsom. Despite both cities being within the same county, the lived experiences of residents of these two cities vary.
Sacramento city is relatively large and racially diverse, with over 500,000 residents. More than two thirds of the city’s residents are people of color. In contrast, Folsom is relatively small and less diverse, with just under 80,000 residents, a majority – 55.9% – who are White. While both cities have similar employment rates, Folsom is comparatively wealthy with a higher average per capita income ($52,261 vs. $35,793) and a higher home ownership rate (69.3% vs. 50.1%).
The story of Sacramento and Folsom is similar to that of many cities across California. As Sacramento became more diverse, its more affluent, White residents left the city in droves and many landed in nearby Folsom. As a result of this White flight, Sacramento lost resources and Folsom gained them, which helped lay the groundwork for the inequities between the two cities that we see today.
In this blog we will uplift findings from four RACE COUNTS city level indicators that are illustrative of racial disparity and inequity at the city level.
Systems inappropriately applied in lower income, more diverse cities
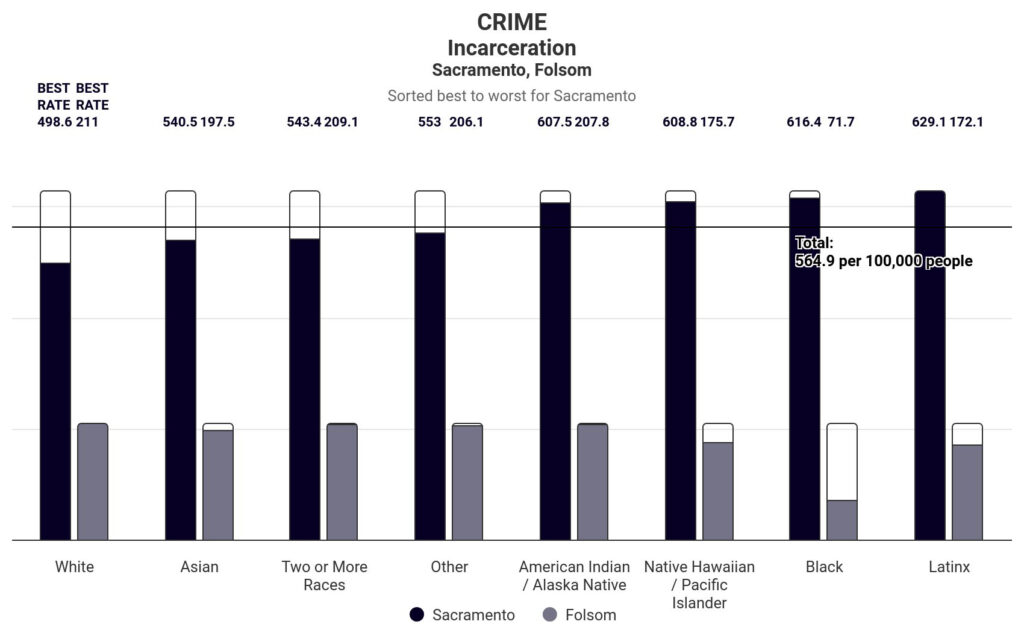
When we look at the Incarceration indicator for both the city of Sacramento and Folsom, we see that the incarceration rate is higher in Sacramento than Folsom. According to RACE COUNTS data, Sacramento has 3,094 incarcerated people compared to 159 incarcerated people in Folsom. Furthermore, we see that the incarceration rate is higher for every racial and ethnic group in Sacramento compared to Folsom. For example, the incarceration rate for Sacramento’s Black residents is over 8 times that of Folsom’s Black residents. These findings are consistent with the reality that racist systems and policies, such as over policing and harsh sentencing, are often inappropriately and disproportionately applied in lower income, more diverse cities.
Issues impacting low income, more diverse communities may have little impact on high income, more White cities
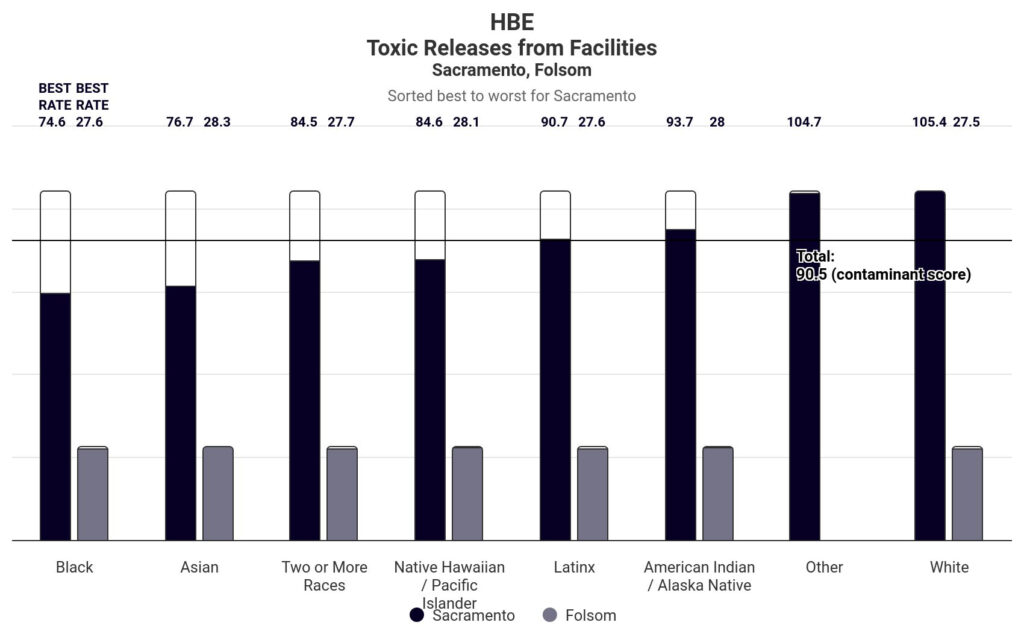
Examining the Toxic Release from Facilities indicator show us that Sacramento city residents are exposed to pollutants much more than Folsom residents with Sacramento’s contaminant score being over triple Folsom’s. This finding highlights the idea that the issues impacting low income, more diverse cities often do not have the same impact in wealthier, Whiter cities. Toxic release from facilities is an illustration of this. Redlining and other racist zoning policies frequently resulted in the placement of facilities that release pollutants in low income, more diverse cities.
Systems not supporting some groups regardless of city
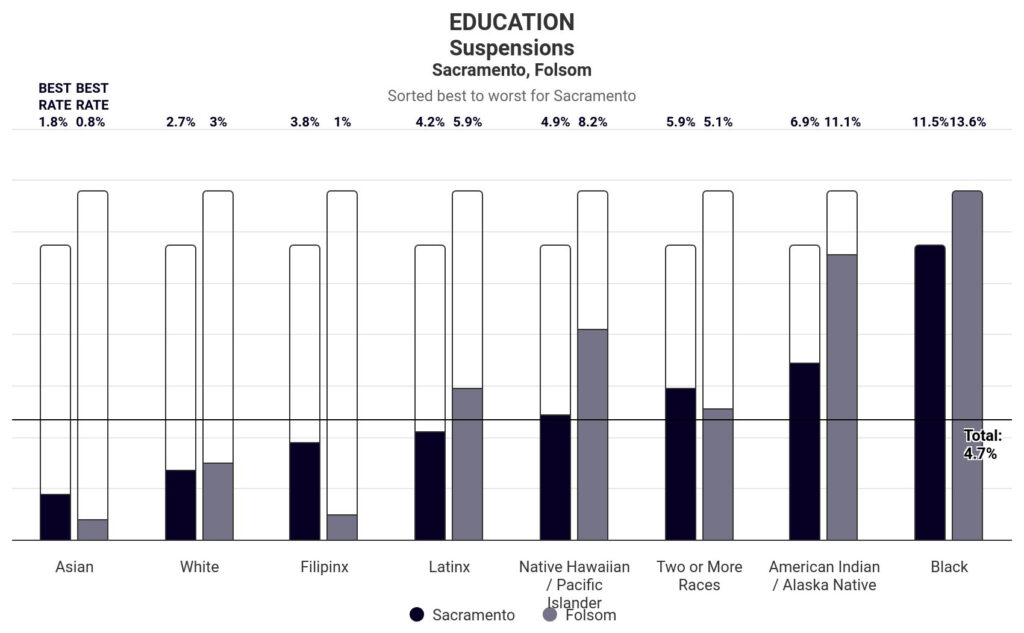
When looking at the data for the Suspensions indicator, what stands out is the high suspension rates for Black students in both Sacramento and Folsom. In both cities, Black students have a suspension rate much higher than the city average. This finding is consistent with the general reality that in many instances, regardless of city, systems often do not support – and frequently punish – some racial and ethnic groups. For example, anti-Blackness affects both Sacramento and Folsom students and even though Black Folsom students live in a relatively wealthier city they are still exposed to many of the biases and prejudiced policies that result in high suspension rates.
Systems work for some advantaged groups regardless of city
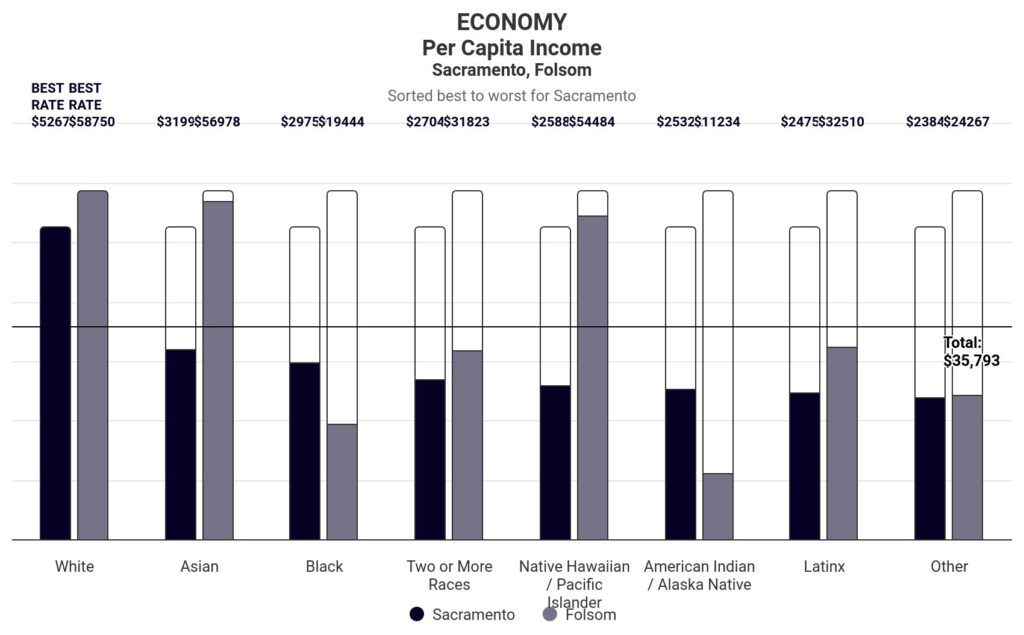
In many ways the findings for Per Capital Income is a mirror image of the findings for Suspensions. While Suspensions show that Sacramento and Folsom’s Black students are not being supported by systems, Per Capita Income shows that Sacramento and Folsom’s White residents are. Specifically, we see that White residents of both cities have the highest per capita income of all racial and ethnic groups. This finding is illustrative of the broad advantages and privileges that many White Californians experience independent of what city they live in. For example, the relatively high per capital income for White residents of both Sacramento and Folsom is, in part, the result of racist policies and systems – such as redlining and employment discrimination – that disadvantage Californians of color and, in turn, provide advantages for White Californians. These racist policies and systems exist and impact Californians in both low income, more diverse cities and high income, more White cities.
Conclusion
This comparison of Sacramento and Folsom highlights some of the ways that racial inequity operates at a city level. In particular, the comparison uplifts the reality that systems are often inappropriately applied in low income, more diverse cities, that these cities frequently experience issues to a greater extent than wealthier, Whiter cities, and that systems often fail to support certain racial and ethnic groups while supporting others regardless of city. While it may be tempting to believe that Sacramento and Folsom are somehow unique and that the dynamics and realities uplifted by comparing the data between these two cities do not exist elsewhere, the unfortunately reality is that these inequities exist throughout the state. That is because the forces that create and perpetuate these inequities – for example, historical discrimination and structural racism – exist in all California cities. And this is why we’re excited that RACE COUNTS now has city level data, which will allow users to get a better understanding of the disparities and inequities that impact their community. We encourage users to look at the data for their city and take action to address their city’s disparities.