COVID-19 And The True Cost of Reopening
Table of contents
A year after reporting the first cases of COVID-19 in California, the state once again stands at a crossroads. On one hand, California suffered one of the harshest winter surges of any state in the nation and saw the racial disparities – that have been a hallmark of this entire crisis – explode to new, tragic levels that dwarf the disparities seen in prior surges. On the other hand, we have the chaotic yet hope-filled rollout of the vaccine starting to ramp up throughout the state. The appalling racial disparities we see from the winter surge were fueled by the same, structural dynamics that drove them in prior surges – the disproportionate number of low-income people of color in the in-person, essential workforce, overcrowded and multi-generational housing, and generations of systemic racism that have made communities of color fertile ground for the virus. Now, as our collective attention turns towards the massive undertaking of vaccinations, we must never lose focus on controlling the virus’ spread within California’s most vulnerable communities and never forget the dear cost we as a state have extracted from them over this past year.
With roughly one out of every 13 Californians having tested positive for coronavirus at some point during the pandemic – we continue to see a dis-spiriting level of deaths as a lagging indicator from the surge. Different regions in the state were hit at dramatically different levels from one another. Regions like Southern California (with LA County at a time being the global epicenter of the pandemic) and San Joaquin Valley took the brunt of the impact. And underneath the swirling numbers, there lies the threat of MULTIPLE, more transmissible COVID-19 variants that can burst through any modeling and projections of where this virus will go next. As has been the case through much of the pandemic – surges take a tragically high toll on Latinx, Black, Native Hawaiian and Pacific Islander (NHPI), and American Indian and Alaskan Native (AIAN) Californians.
As the case counts start to come down, it’s important to remember that the actions of state and local leaders to institute much more restrictive measures in late November and early December helped blunt the catastrophic rise in cases and why we are now seeing numbers move in the right direction. We know what works. However, even after a precipitous decline in cases the past couple of weeks – the case numbers are still nearly three times the level we saw at the height of the winter surge. And given this extraordinary level of community transmission and without a full handle on these new variants – we must not simply return to the pre-surge, pre-variant balancing act between the public’s health and powerful private interests’ push to reopen businesses. Instead, it is incumbent on both state and local elected officials to immediately modify their reopening plans, augment support for the in-person workforce and their families, and produce an at-scale and transparent equity plan for vaccine distribution. If not, we will likely see another surge and the continuation of high infection rates in California’s most vulnerable communities.
The Human Cost Of Reopening
Throughout the pandemic, the ability of some to safely shelter at home has been possible only because workers are risking infection to deliver our mail, groceries, and online purchases, provide care for the elderly and perform other essential work. Nationally, over 50% of Black, Latinx, and AIAN workers are essential workers or non-essential workers that must work in-person.i Black and Latinx workers in California have the highest rate of employment in essential jobs.ii Asian, Black, and Latinx workers are disproportionately likely to work in jobs that involve close physical proximity.iii Given these conditions, it is easy to see how reopening the economy, along with existing vulnerabilities, put Californians of color at greater risk and lead to disproportionate impact.
Tracking the impact of reopening and closures by race
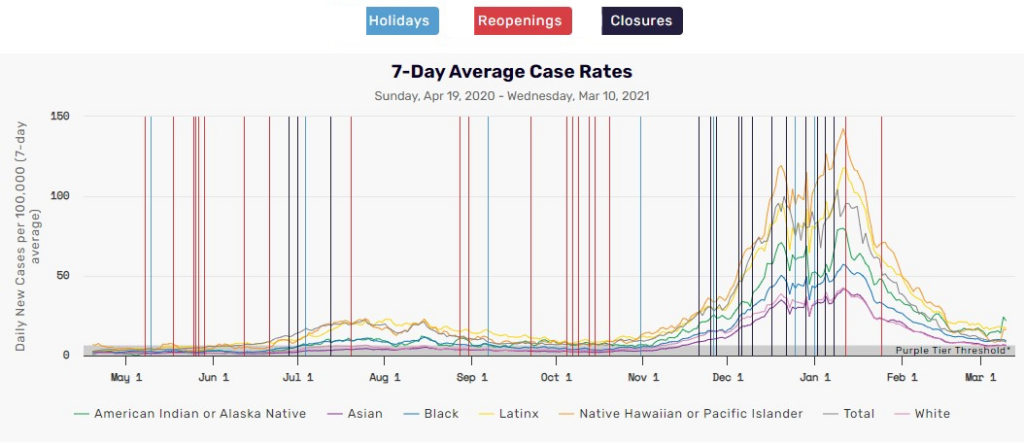
Tracking 7-day average case rates by race and ethnicity lays bare the roller coaster of rising and falling case rates our state and communities have endured. Periods of declining or flat case rates are met with reopenings at the state and local levels that fuel future surges, even while case rates among many people of color remain higher than other groups and above what the state considers lower rates of transmission.
Using data from the California Department of Public Health, we calculate the rolling 7-day average case rate by race and ethnicity from mid-April 2020 until now. We compare 7-day average case rates against holidays, reopenings, and closures to evaluate the impact of reopening businesses on case rates. We focus on reopenings to see how returning people to work, opening more businesses, and overall creating greater movement between people coincided with increased rates among certain groups.
Our data show that average daily case rates for our NHPI, Latinx, Black, and AIAN populations have frequently exceeded one of the criteria set by the state to allow counties to move toward reopening. On August 28th, 2020, the state established criteria for loosening and tightening restrictions on activities in the Blueprint for a Safer Economy. Counties were assigned to tiers based on their positivity rates, adjusted case rates, and a health equity metric. Reopening case rate thresholds were set at a past 7-day average of 7 new daily cases per 100,000 to move from the most restrictive purple tier to the second most restrictive red tier. This threshold and other criteria indicated that counties could allow certain businesses to reopen with a focus on indoor non-essential businesses. Statewide 7-day average case rates for Latinx and NHPI populations rarely dipped below the 7 new daily cases per 100,000 threshold and were often far above this threshold even as county economies reopened.
As of January 25, 2021, the state lifted the regional stay-at-home order for all areas, allowing even purple tier counties to consider resuming business activities that had been closed. At that time, 7-day average case rates among Latinx and NHPI populations were over eight times the 7-day average threshold for the state’s purple tier. Alarming case rates among these communities of color have done little to slow the reopening of our state and county economies during the summer, and now, winter surges.
These trends are unsurprising given the role people of color play in essential and non-essential areas of our economy. By occupation, Latinx workers are overrepresented as cooks, food preparation workers, cashiers, stockers, and order fillers, among other occupations.iv Black workers are likewise overrepresented as food preparation workers, customer service representatives, and office clerks. These are some of the positions directly affected by the reopening and restricting of retail and foodservice sectors during and after surges.
Limitations: While our analysis demonstrates the link between reopenings and increasing case rates, other factors have contributed to surges. The winter surge that eclipsed case rates seen over the summer suggests a unique, added effect from fall and winter holidays along with other factors, like private gatherings between households. In addition, this analysis does not include the individual reopening decisions made by each county. While the state makes decisions about which sectors counties may consider reopening, counties can impose stricter local guidelines. However, many counties, including the state’s largest (Los Angeles), reopened quickly throughout the summer and will reopen following the lifting of the state’s regional stay-at-home order rather than opting for a stricter approach.
The impact of 7-day average case rates by race
To show the disparate impact of reopenings on rates by race, we plot 7-day average case rates by race against holidays and key reopening and closure dates throughout the pandemic. The summer and winter surges and the resulting increase in rates for Latinx and NHPI populations in particular, were preceded by rapid reopenings during periods of case declines.
Using the summer surge as an example, we see that 7-day average case rates by race began to diverge following state reopenings in May and June that occurred before and after Memorial Day, Father’s Day, and the Fourth of July. The growth in 7-day average case rates for the Latinx and NHPI communities outpaced the growth rates for other groups. Holidays alone do not appear to correlate with surges in case rates. For example, Mother’s Day on May 8th and Labor Day on September 7th did not coincide with an increase in 7-day average case rates. Even Thanksgiving and Christmas occurred during a visible surge in case rates that was preceded by reopenings in October 2020. Now, as the state and counties move away from the regional stay-at-home order 7-day average case rates remain higher than rates observed at any time during the summer surge.
Methods: To track reopening and closure dates, we reviewed the Governor’s and the State Public Health Officer’s orders and their social media accounts that the state often uses to post updates on reopenings. Given that LA County is the state’s most populous county and a significant share of total COVID-19 cases, we include key reopening dates for LA County where the county opened faster or slower than the state.
The impact on changes in 7-day average case rates by race
Focusing on three reopening periods preceding the summer surge, we further highlight the disparate impact of reopenings on case rates by race. We compare periods where just a holiday occurred, or fewer sectors reopened and a holiday occurred, to periods with expanded reopenings to disentangle the effect of reopenings from holidays. The data show greater case rate increases 2 and 3 weeks after broader reopenings – particularly for Latinx and NHPI populations, followed by Black and sometimes AIAN populations.
Methods: We zoom in on three periods around May 8th, May 25th, and June 12th. We use May 8th as a baseline, which marked the state’s limited reopening of low-risk businesses and retail, mainly for curbside pickup, this period includes one holiday—Mother’s Day. We show how changes in case rates for this period compare to changes in case rates following two periods of expanded reopenings: May 25th and June 12th. On May 25th, Memorial Day, the state announced the reopening of in-store retail shopping and in-person religious services, and a day later, the reopening of barbershops and hair salons. Four days later, LA County reopened indoor dining. On June 12th, the state allowed counties with attestations to overall epidemiological preparedness to reopen bars, restaurants, wineries, gyms, museums, cardrooms, and several other sectors. We calculate the 7-day average case rates by race/ethnicity at the start of each reopening, two weeks after, and three weeks after. We then calculate the difference in case rates by subtracting each week’s case rate from the beginning rate.
Results
Given ongoing conditions, controlling the spread of COVID-19 must be prioritized over economic recovery. Our government, at all levels, must act. Disparate pandemic impact on working-class Californians and Californians of color must be addressed. We must not prematurely reopen the economy and allow the pandemic to ravage our most vulnerable residents and communities once again. Vaccines should be distributed equitably. In addition, we must also support workers, the hardest-hit communities, local public health departments, and small businesses.
The following recommendations are directed to local, state, and national policymakers to provide guidance to address the inequitable economic and health impacts of the COVID-19 pandemic and what is needed to strengthen our public health infrastructure.
Strengthen the state’s framework for regional and county reopenings to prevent a repeat of the winter surge:
- Reimplement and revise the Regional Stay at Home Order adjusting criteria from the order to include 7-day average rates by race and for release from the order, current ICU capacity. Projected and current ICU capacity provides us two measures of transmission and risk levels in our state. However, ICU capacity alone does not take into account disproportionate impact by race where some groups in our state may still be bearing the largest load in cases and deaths.
- Revise the state’s Blueprint for a Safer Economy to include a more stringent tier below the Purple Tier. This new tier should strongly encourage counties that have been released from the Regional Stay at Home Order but are still surpassing certain thresholds for overall ICU capacity or 7-day average rates for any racial group to keep non-essential businesses, outlined in the Regional Stay at Home Order, closed.
Center equity in vaccine distribution:
- Use data to identify hotspot communities that have been hardest hit by the pandemic and target and prioritize vaccine distribution in these communities;
- Prioritize vaccinating individuals and their families who have been disproportionately impacted by COVID-19 or who are at high infection risk. These individuals include, but are not limited to, Latinx, Black, NHPI, and AIAN individuals, essential workers who must work in-person and live in multi-generational/multi-family households, and individuals living in congregate settings;
- Ensure that vaccine distribution sites are accessible through multiple modes and are open during hours that accommodate a variety of work schedules;
- Build trust and leverage trusted messengers in impacted communities to facilitate vaccine access and uptake; and
- Engage and center Latinx, Black, NHPI, and AIAN communities in COVID-19 vaccine policy responses.
Expand worker protections and voice:
- Make medical grade face masks available to workers whose jobs require them to work in-person;
- Increase public health departments’ workplace compliance personnel;
- Create workplace public health councils and protect workers against retaliation for reporting employer non-compliance with public health directives;
- Provide monetary stipends and free quarantine facilities to infected low-wage essential workers; and
- Enact policies to guarantee workers’ right to return to their jobs following illness and quarantine.
Provide additional government aid to vulnerable individuals and communities:
- Extend unemployment insurance to all workers impacted by the pandemic;
- Target government aid to impacted households and hotspot communities; and
- Find a path to cancel rental obligations and mortgage payments for low-income Californians.
Provide additional support for public health department and small businesses:
- Increase state and federal funding for public health departments to fulfill their mandates; and
- Provide financial support to small businesses, and low-income entrepreneurs.
Build a cadre of community-based responders in hardest-hit communities by leveraging trusted community organizations:
- Create a statewide Equity Corps program that would channel funds to community-based organizations working in COVID-19 hotspots and for highly-impacted communities. Funding would support their resident outreach efforts, including providing information on public health guidance and vaccine access, as well as connecting residents to resources to help them bridge the digital divide, access support for mental health, food, housing, and other basic needs, and inform them about new rights and resources for workers and tenants.
Conclusion
California strives to be the most compassionate, progressive state in the union. We can achieve this by protecting the lives of Black, Latinx, NHPI, and AIAN Californians by not prematurely lifting regional restrictions and equitably distributing vaccines.
California’s recent decision to lift Regional Stay at Home orders does not mean that county governments must align with the state’s guidelines. Counties with high case rates and severely strained health systems should think twice before aligning with the state. Decisions to reopen aspects of the economy even as case rates remain high will lead to increased infections and have disparate impacts. Recent scientific modeling by Columbia University makes clear that vaccinations alone will not end the pandemic. Restrictions together with vaccines reduce the number of infections.v Lifting restrictions too soon equals increased infection, illness, and death. In California, those falling ill and dying will be disproportionately Black, Latinx, AIAN, and NHPI. Making decisions that result in illness and loss of life for our most vulnerable neighbors is far from compassionate or progressive.
Reopenings not only lead to infections and illness, but they also do not put us on a path to economic recovery. Although it runs counter to what some would think, across the country, state-ordered reopenings have led to only modest increases in economic activity because many consumers have reduced their spending on in-person services and are not likely to resume spending until the COVID-19 public health threat is resolved or effectively controlled.vi The best approach to spur economic activity is to invest in ending the COVID-19 public health threat.
Elected officials’ pursuit of balance between public health guidance and business interests has resulted in Black, Latinx, NHPI, and AIAN Californians’ disparate case and death rates. Elected officials at all levels of government must rise above the false choice between Californians’ lives and livelihoods by keeping regional restrictions in place until all racial and ethnic groups reach lower levels of daily new cases per 100,000. Reopening economies when racial and ethnic group case rates remain above the established threshold fuels disparate impacts.
It is indisputable that the pandemic has preyed on those made vulnerable by structural and systemic racism. Our policymakers must not perpetuate structural inequity through their reopening and vaccine distribution decisions. Instead, they must pursue policies that end inequities.
About The Data
Data sources
COVID-19 Cases and Deaths:
California Department of Public Health, California Open Data Portal, COVID-19 Cases-Ethnicity Demographics. Retrieved from https://data.ca.gov/dataset/covid-19-cases.
L.A. Times Data Desk, California Coronavirus Data, County Totals, Retrieved from https://github.com/datadesk/california-coronavirus-data.
Population Estimates:
U.S. Census Bureau, American Community Survey 5-Year Estimates (2014-2018), Table DP05.
Reopening and Closure Dates:
California Department of Public Health, Office of Public Affairs, CDPH News Releases 2020, Retrieved from: https://www.cdph.ca.gov/Programs/OPA/Pages/New-Release-2020.aspx.
Office of Governor Gavin Newsom, Newsroom, Retrieved from: https://www.gov.ca.gov/newsroom/.
County of Los Angeles Department of Public Health, Communications & Public Affairs, 2020 Press Releases, Retrieved from: http://publichealth.lacounty.gov/phcommon/public/media/mediapubdisplay.cfm?unit=media&ou=ph&prog=media.
Los Angeles Times, Tracking California’s Coronavirus Closures and Reopenings, Retrieved from: https://www.latimes.com/projects/california-coronavirus-cases-tracking-outbreak/reopening-across-counties/.
Methodology
Case and Death Rate Calculations: We join case and death counts from the California Department of Public Health and Los Angeles Times to population estimates from the 2014-18 American Community Survey. We calculate case and death rates per 100,000 people of each race and ethnicity as well as per 100,000 in the total population. Total case and death rates are calculated by adding case and death counts across counties. We calculate the rolling 7-day average of new cases by subtracting the total number of cases and deaths for each day from the number of cases and deaths reported 6 days before and then divide by 7. We then calculate rates per 100,000 of each race and ethnicity. In cases where the 7-day average rate is less than zero, we convert these estimates to null or missing estimates. This only happens in the case of small population groups (AIAN and NHPI) where there are corrections in their data. Seven-day average rates for these small population groups should be interpreted with caution.
Race and Ethnicity Designations: We follow the race and ethnicity categories available in COVID-19 data from the California Department of Public Health. These categories include American Indian or Alaska Native, Asian, Black, Latino, Multi-Race, Native Hawaiian or other Pacific Islander, Other, and White. While the state reports data for “Other” and “Multi-Race,” we do not publish rates for these groups given our uncertainty in their population estimates, since it is unclear from state data who are grouped into these categories. Estimates for the racial groups American Indian or Alaska Native, Asian, Black, Native Hawaiian or other Pacific Islander, and White do not include Latinx individuals.
Comparison Ratios: To make comparisons between groups, we divide each group’s case and death rate per day by the lowest rate for each day. In other words, if the lowest case rate of the day is among the Asian population, we divide all other groups by the rate among Asians. We exclude American Indians or Alaska Natives as well as Native Hawaiians or Pacific Islanders from having the lowest 7-day average case or death rate given ongoing fluctuations in their data reported by the state. While there may be a single day where they have the lowest rate, their counts are often adjusted upwards in the following days following misclassification events and corrections in the data.
Reopening Dates:
To examine the impact of reopenings on case rates by race and ethnicity, we reviewed the Governor’s and State Public Health Officer’s press releases as well as their social media accounts, which the state often uses to post updates on reopenings. We focus on statewide actions, but also include major reopenings from LA County given the size of the county and its total share of cases. To evaluate how case rates changed after reopenings, we chose a baseline period where few reopenings, or lower risk reopenings, occurred. This allowed us to see how the case rate changed 1 to 3 weeks after reopenings compared to a period where few businesses had reopened.
Our analysis is limited by its statewide focus and does not include the individual reopening decisions made by each county, outside of Los Angeles. Some counties could have chosen a stricter approach than the guidance provided by the state before each surge. Additionally, while our analysis shows a correlation between case rate increases and reopenings, we cannot say definitively that reopenings alone increased case rates. There are several other factors in addition to reopenings that affect transmissions, including holidays and gatherings. However, we do believe our analysis provides evidence about the disproportionate impact of surges and reopenings on people of color in the state.
Acknowledgements
Recommendations developed in partnership with the RACE COUNTS Steering Committee.
Research and data analysis by Elycia Mulholland Graves, Rob Graham, Chris Ringewald, Leila Forouzan, and Laura Daly.
Written by Maria Cabildo, Elycia Mulholland Graves, Matt Trujillo, and John Kim.
Conceptualization support from John Kim and Chris Ringewald.
Editing support from Mike Russo, Amy Sausser, Ron Simms Jr., Katie Smith, Chris Ringewald, and Leila Forouzan.
Messaging and communications support from Ron Simms Jr. and Katie Smith.
Design and page development by Rob Graham and Katie Smith.
Citations
i Artiga, Samantha, Rachel Garfield, and Kendal Orgera. “Communities of Color at Higher Risk for Health and Economic Challenges Due to COVID-19.” KFF, April 8, 2020. https://www.kff.org/coronavirus-COVID-19/issue-brief/communities-of-color-at-higher-risk-for-health-and-economic-challenges-due-to-COVID-19/.; Advancement Project California. “Economic Opportunity.” Race Counts. Accessed December 10, 2020. http://www.racecounts.org/issue/economic/.
ii Catalyst California. “Housing.” Race Counts. Accessed December 10, 2020. http://www.racecounts.org/issue/housing.
iii Leifheit, Kathryn M, Sabriya L Linton, Julia Raifman, Gabriel Schwartz, Emily A Benfer, Frederick J Zimmerman, and Craig Pollack. “Expiring Eviction Moratoriums and COVID-19 Incidence and Mortality.” SSRN, November 30, 2020. https://papers.ssrn.com/sol3/papers.cfm?abstract_id=3739576.
iv Catalyst California. “Health Care Access.” Race Counts. Accessed December 10, 2020. http://www.racecounts.org/issue/health.
v Bogardus Drew, Rachel, and Ahmad Abu-Khalaf. “Linking Housing Challenges and Racial Disparities in COVID-19.” Enterprise Community Partners, April 15, 2020. https://www.enterprisecommunity.org/blog/04/20/housing-challenges-racial-disparities-in-COVID-19.
vi Dubay, Lisa, Joshua Aarons, Steven Brown, and Genevieve M. Kenney. “How Risk of Exposure to the Coronavirus at Work Varies by Race and Ethnicity and How to Protect the Health and Well-Being of Workers and Their Families.” Urban Institute, December 2, 2020. https://www.urban.org/research/publication/how-risk-exposure-coronavirus-work-varies-race-and-ethnicity-and-how-protect-health-and-well-being-workers-and-their-families.
vii Thomason, Sarah, and Annette Bernhardt. “Front-Line Essential Jobs in California: A Profile of Job and Worker Characteristics.” UC Berkeley Labor Center, July 1, 2020. https://laborcenter.berkeley.edu/front-line-essential-jobs-in-california-a-profile-of-job-and-worker-characteristics/.
viii Huang, Kuochih, Tom Lindman, and Annette Bernhardt. “Physical Proximity to Others in California’s Workplaces: Occupational Estimates and Demographic and Job Characteristics.” UC Berkeley Labor Center, December 7, 2020. https://laborcenter.berkeley.edu/physical-proximity-to-others-in-californias-workplaces/.
ix Thomason, Sarah, and Annette Bernhardt. “Front-Line Essential Jobs in California: A Profile of Job and Worker Characteristics.” UC Berkeley Labor Center, July 1, 2020. https://laborcenter.berkeley.edu/front-line-essential-jobs-in-california-a-profile-of-job-and-worker-characteristics/.
x Raj Chetty, John N. Friedman, Nathaniel Hendren, Michael Stepner, and the Opportunity Insights Team. “The Economic Impacts of COVID-19: Evidence from a New Public Database Built Using Private Sector Data.” Opportunity Insights, November 2020. https://opportunityinsights.org/wp-content/uploads/2020/05/tracker_paper.pdf.
xi Leana S. Wen and Nakisa B. Sadeghi. “Addressing Racial Health Disparities In The COVID-19 Pandemic: Immediate and Long-Term Policy Solutions.” Health Affairs, July 20, 2020. https://www.healthaffairs.org/do/10.1377/hblog20200716.620294/full/.